Medical infographics & factsheets

We create clear, visually engaging medical infographics and factsheets designed to communicate complex science with impact. Our team produces media-ready graphics for publications, consumer-focused science content, and educational materials. We also develop infographics that showcase clinical or development portfolios, making your data easy to digest for stakeholders, investors, or healthcare professionals. Each infographic is crafted to balance scientific accuracy with accessible visual storytelling, ensuring your message is both informative and compelling.

Infographic titled 'Vectors for Delivering Gene Therapy in Hemophilia B,' explaining how adeno-associated virus (AAV) vectors deliver gene therapy. It shows how the AAV vector enters liver cells, releases its DNA, and how the F9 gene variant is expressed selectively in liver cells. Sections cover capsid, expression cassette, and roles in investigation, liver targeting, sustained activity, and safety of hemophilia B gene therapy.

CSL Behring - AAV Infographic

An infographic explaining the role of IL-13 in atopic dermatitis (AD). It features a diagram of inflamed skin, highlighting how IL-13 activates inflammation pathways, leading to symptoms like dry, broken skin, redness, and thickening. The infographic emphasizes ongoing research on IL-13's potential to guide future treatment and management of AD.

Mechanism of disease infographic

A scientific infographic titled 'Forging the Future of Cell Therapy' highlighting advancements in cell therapy, including CAR-T therapy developments for lymphoma and multiple myeloma, with statistics, challenges, solutions, and international manufacturing expansion details.

Clinical portfolio infographic

An infographic titled 'Living Life Between the Highs and Lows of Factor IX (FIX) Replacement' discusses hemophilia B, featuring a cartoon boy named Henrik, who was diagnosed as an infant. The infographic highlights the impacts of hemophilia B, including vein collapse, inhibitors, and ankle surgery. It mentions that about two-thirds of people with hemophilia B have moderate or severe symptoms, 43% face psychosocial burdens, and 95% report negative impacts on employment. It includes illustrations of Henrik managing his chronic pain, balancing employment with adherence to treatment, family life with pain, and choosing between home and hospital for care. The infographic discusses ongoing research and therapy management, emphasizing the importance of careful treatment adherence and the challenges faced by patients.

CSL Behring - Hemophilia B infographic

Diagram showing brain areas affected by childhood verbal, domestic violence, and sexual abuse, including labeled regions like the left auditory cortex, Broca's area, Wernicke's area, and others with descriptions.

Scientific American - Trauma brain regions

Diagram illustrating GLP-1's role in the brain and gut during eating. It shows the process starting with the gut releasing GLP-1 after eating, signaling to the brain via the vagus nerve, and affecting neurons that promote feelings of fullness, thereby stopping eating.

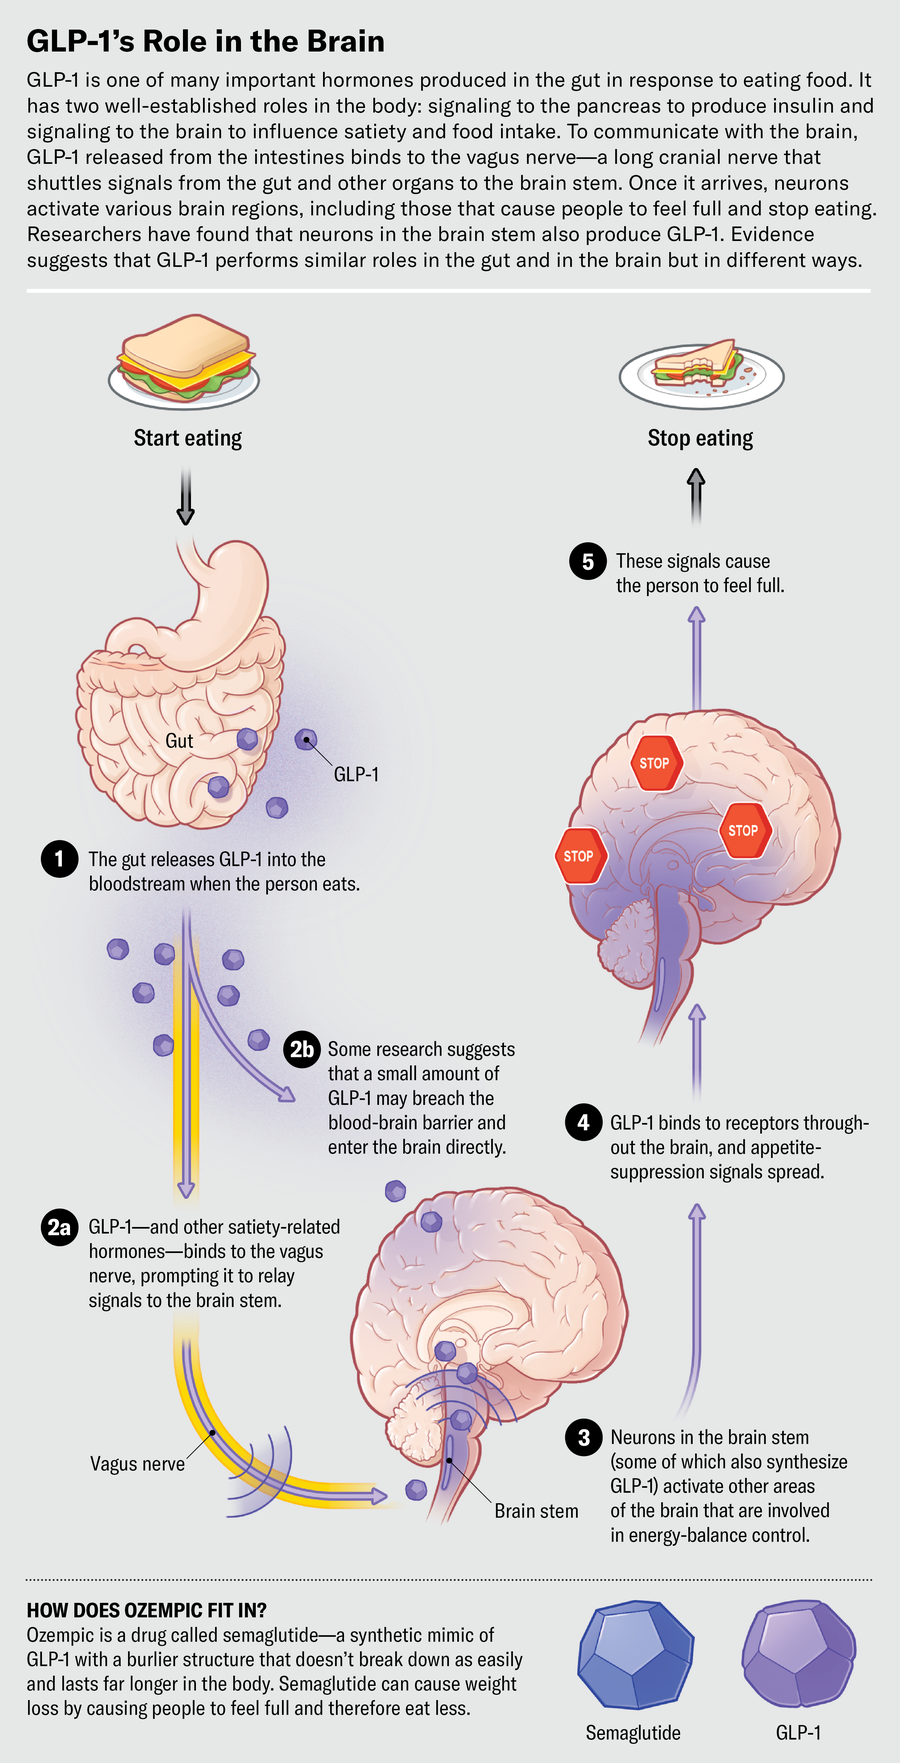
Scientific American - Ozembic GLP-1

Diagram illustrating social behavior of Egyptian fruit bats, showing neurons in their brains activating during communication and group interactions.

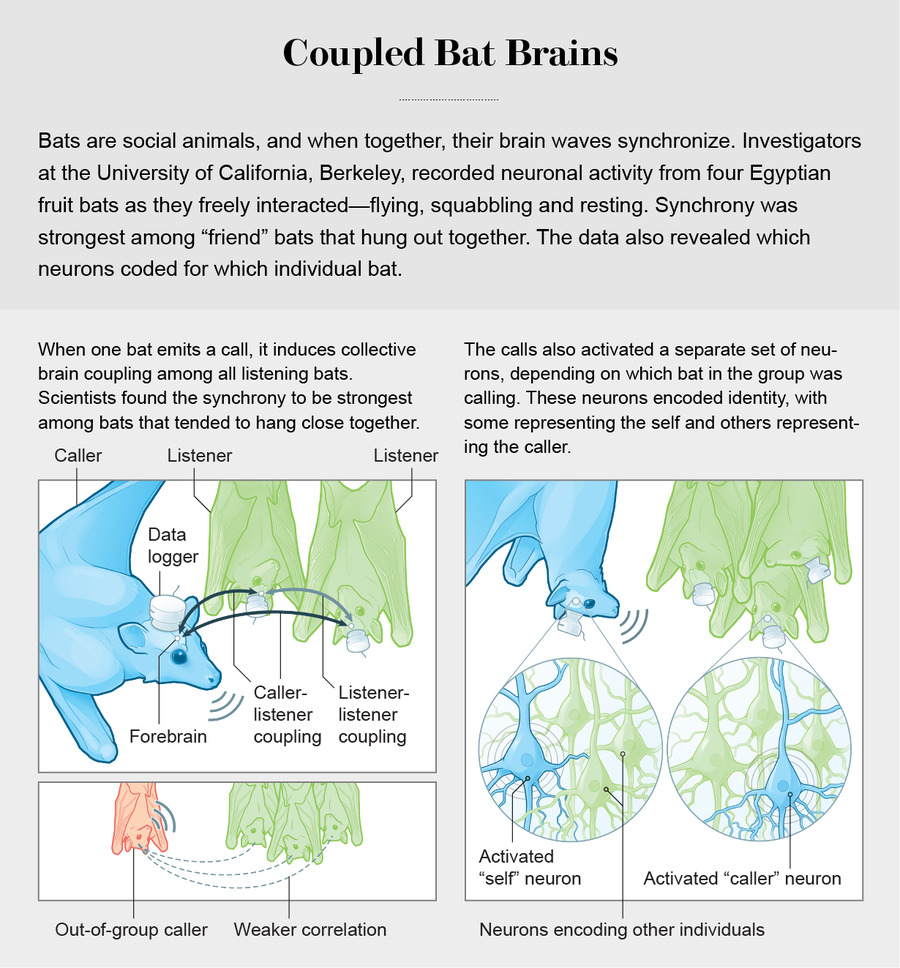
Scientific American Brainwaves and communication

An infographic explaining what goes into a biological cell membrane blob, including condensates, scaffold proteins, client proteins, and RNA, with diagrams showing their formation and functions.

Scientific American

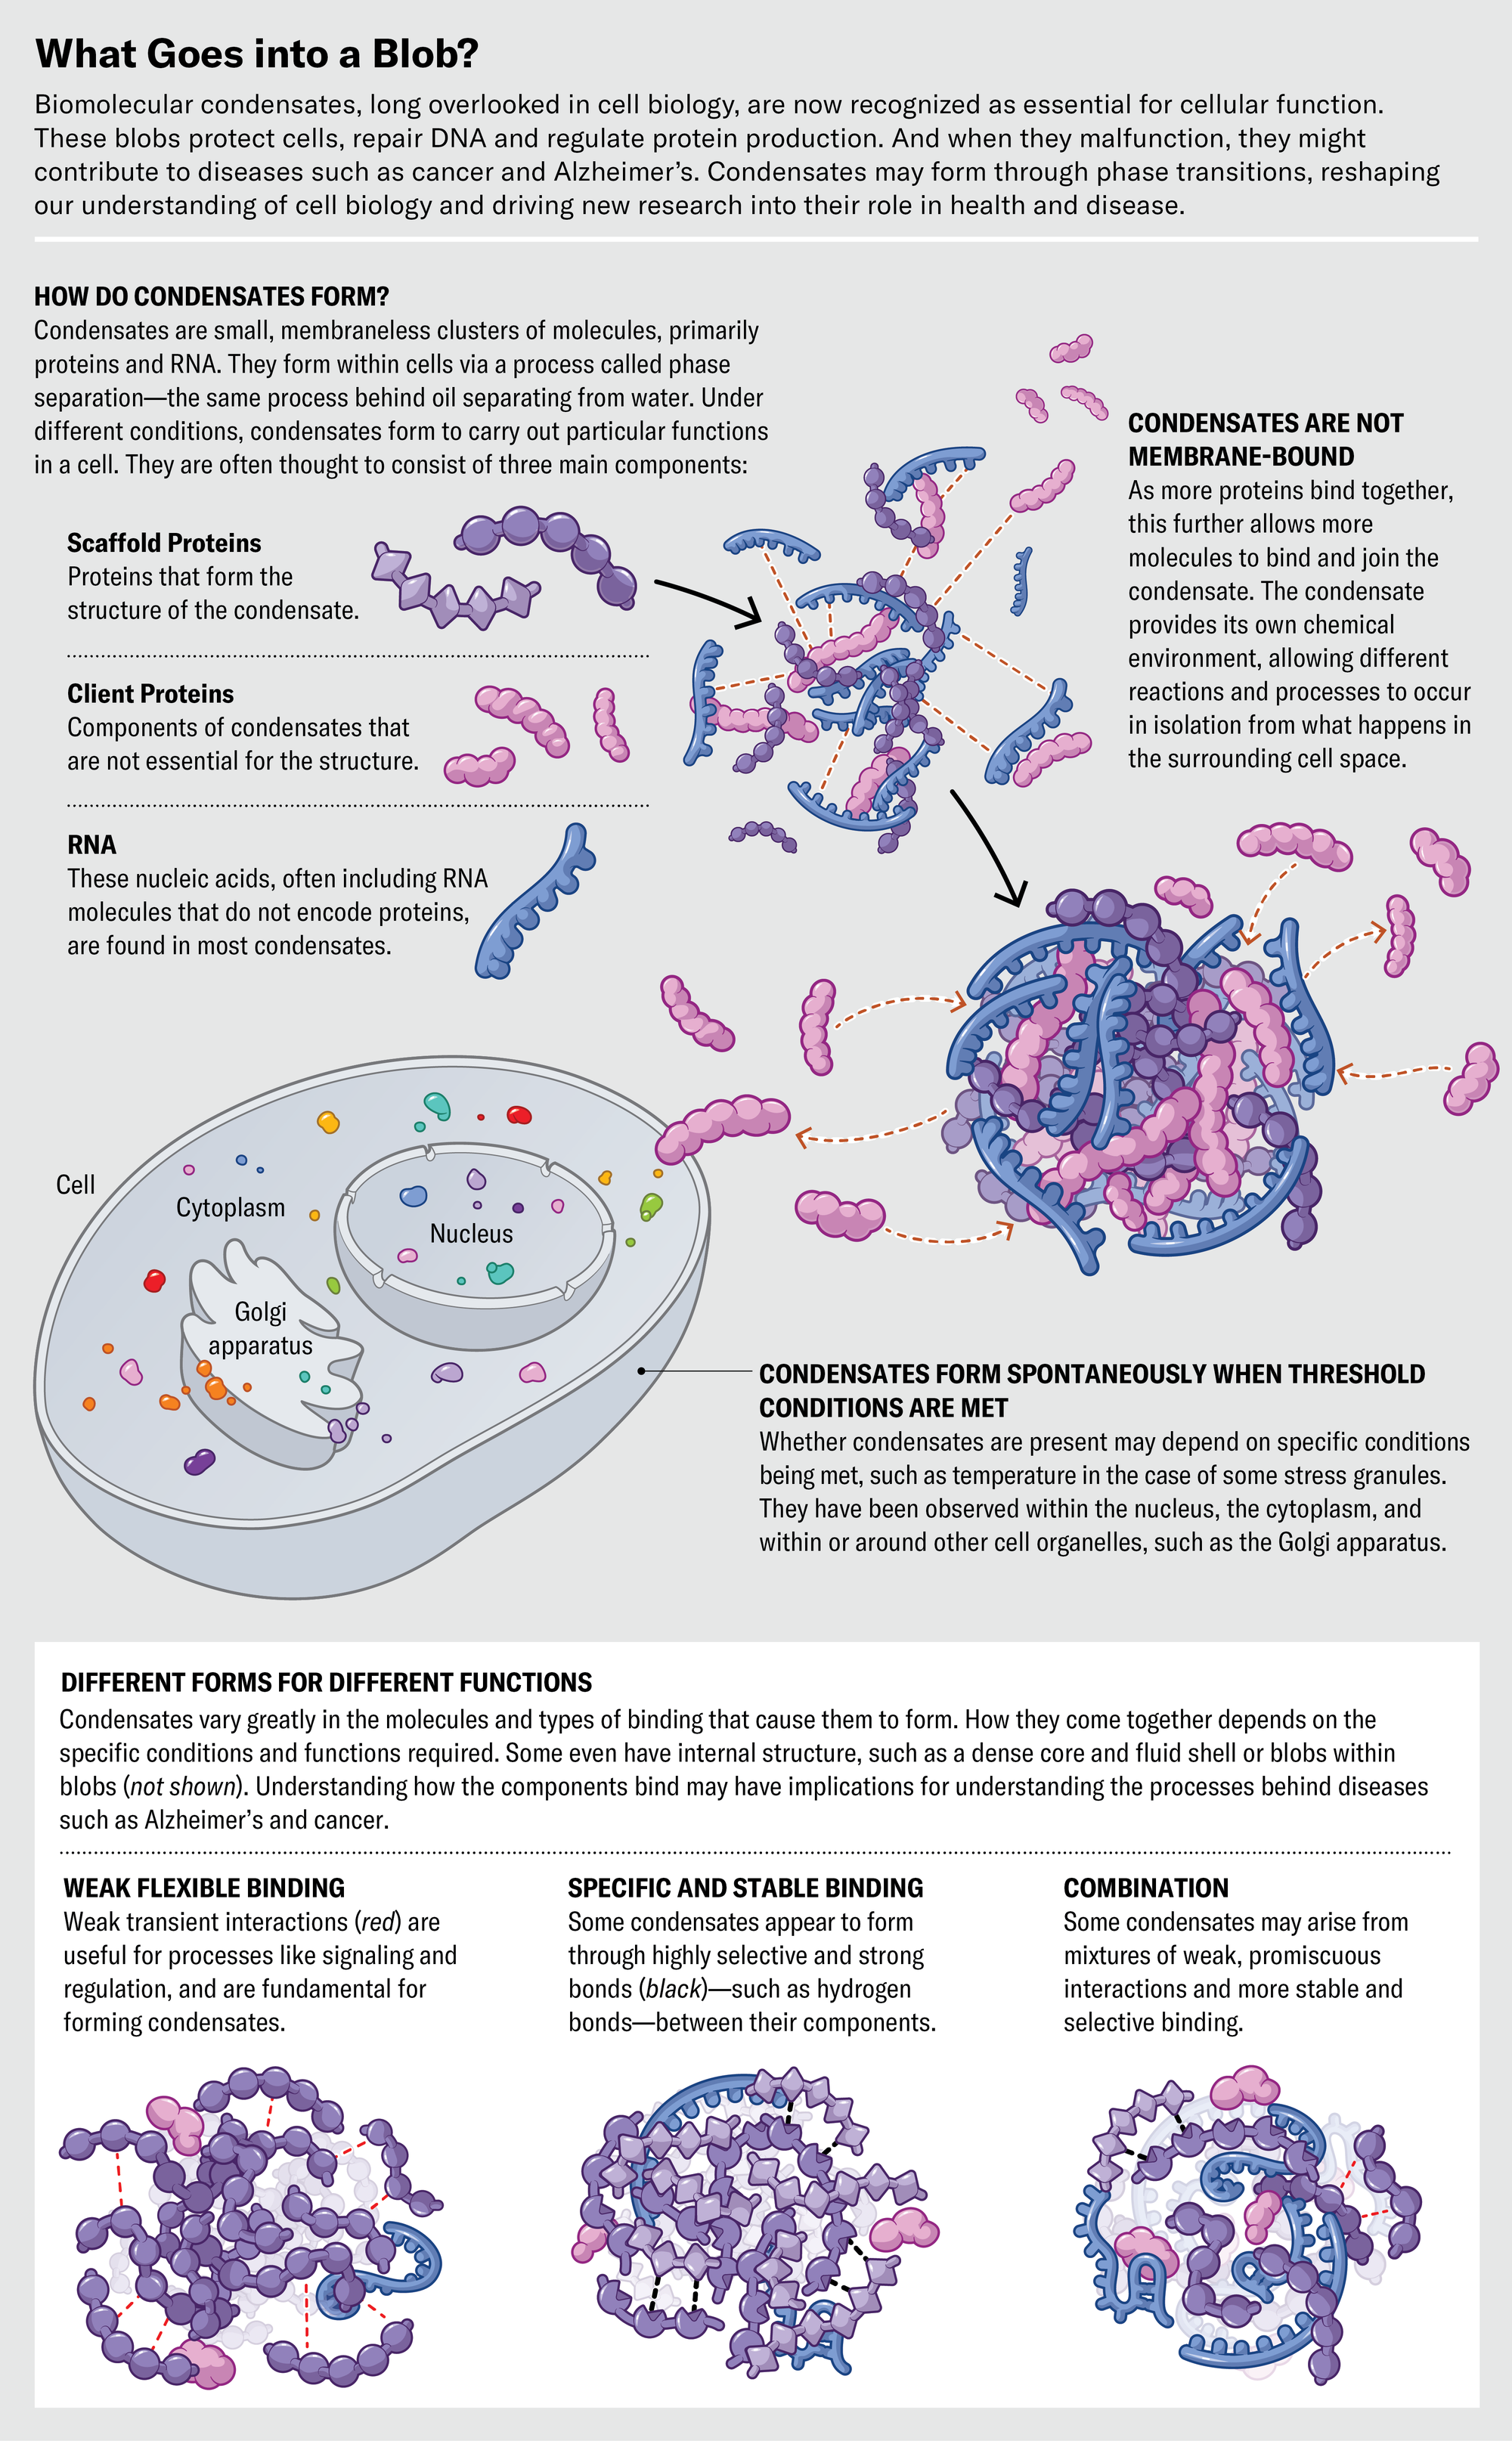
Biological condesates READ THE ARTICLE

Diagram illustrating how psychological stress affects gut health, showing the brain releasing stress hormones via the pituitary gland, communicating with the gut through enteric nerves, and leading to immune cell activation, inflammation, and pain, while also causing reduced healthy neurons and decreased neurotransmitter levels in the gut.

Scientific American

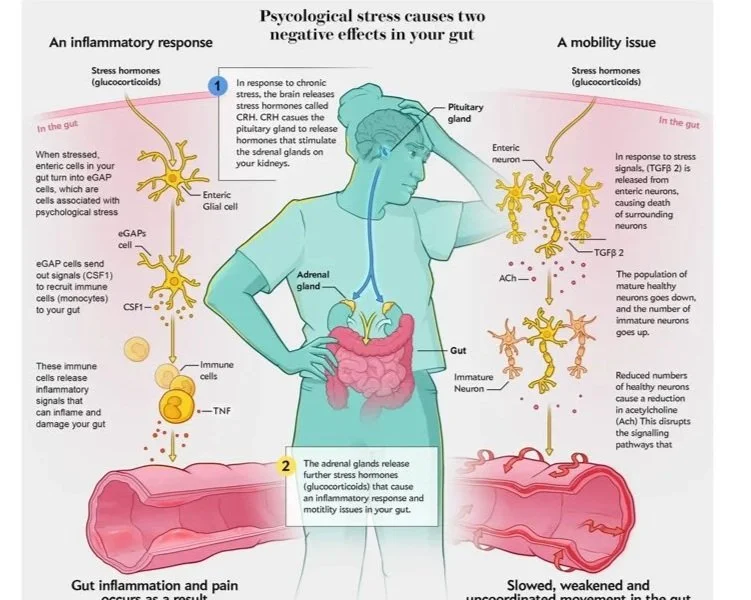
Stress and IBS READ THE ARTICLE

Diagram comparing Parkinson's disease beginning in the gut versus in the brain, showing neural pathways and structures involved in each model, including the gut, brain, and nerve pathways.

Scientific American

Parkinson’s READ THE ARTICLE

Scientific American - Sickle cell disease treatment options medical infographic

Infographic explaining how COVID-19 damages the brain and nervous system, including sections on virus entry into the brain, lingering virus, immune system abnormalities, and macrophage attack, with illustrations of affected brain blood vessels and neurons.

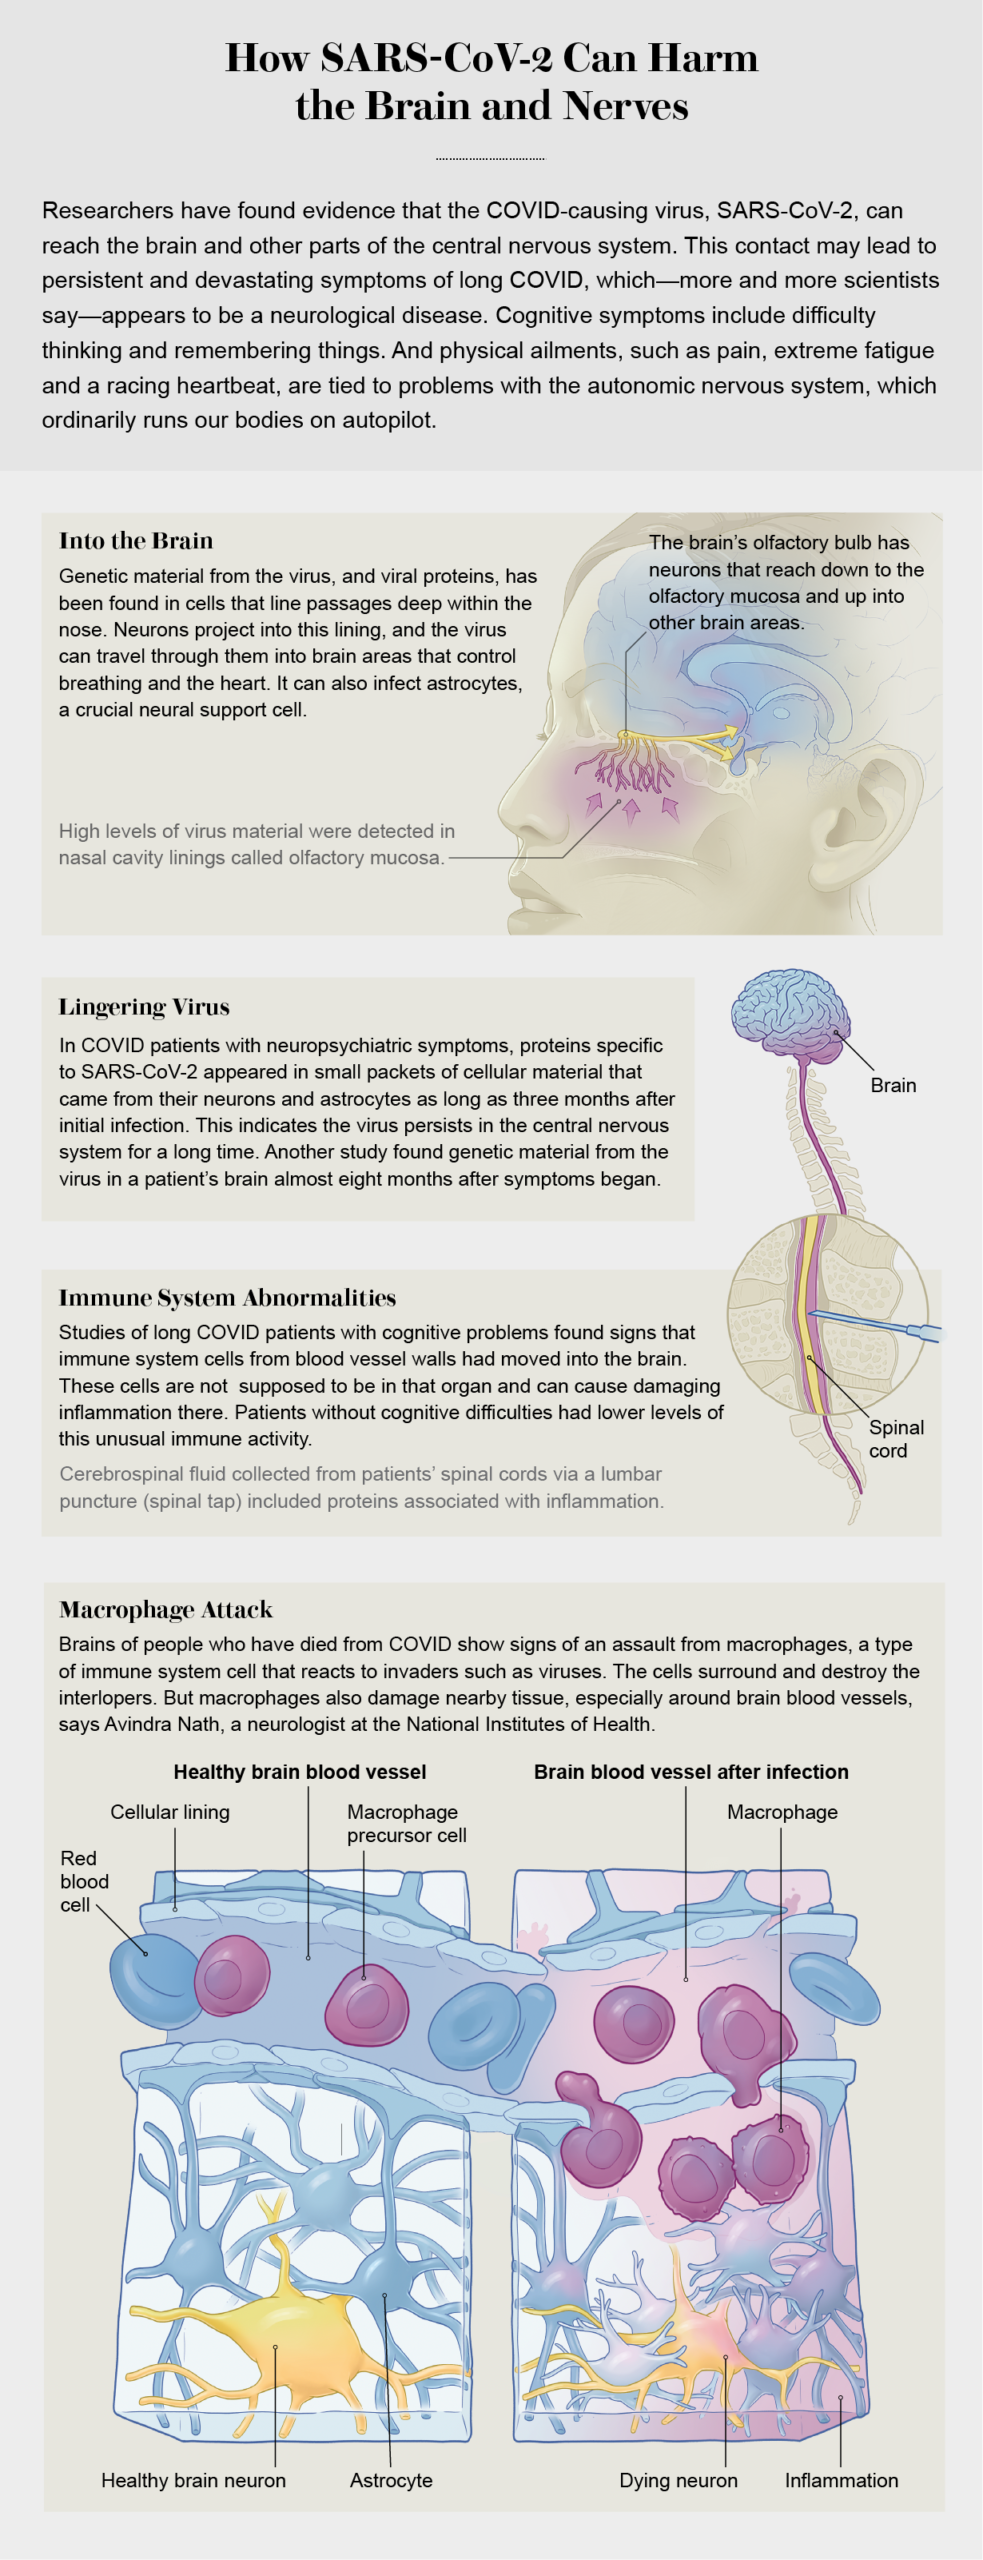
Scientific American - Long Covid Infographic

Educational infographic explaining how the body processes vitamin D, including skin absorption, liver conversion, and kidney transformation, with illustrations of skin, liver, kidney, fish, and supplements.

Scientific American - Vitamin D Medical Infographic

Illustration of a healthcare setting with medical professionals and patients, including scenes at check-in, before vitals, during exam, and sharing results, with placeholder text and numbered sections.

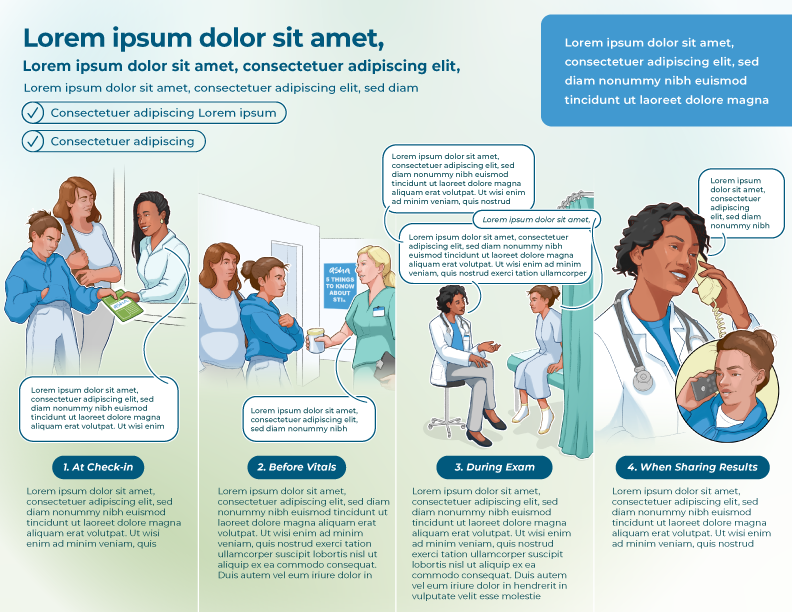
Healthcare infographic - Patient interaction guidelines

Infographic explaining AL amyloidosis, its symptoms, diagnosis, and patient journey with illustrations of a man experiencing chest pain, breath shortness, and swallowing difficulties, depicting months 7, 18, and 24.

Science media infographic - AL Amyloidosis disease summary and statistics

Infographic explaining how IO Biotech's T-win platform generates cancer vaccine candidates that modulate the immune system and target immune-suppressive and cancer cells, including mechanisms of tumor immune evasion, cancer vaccine transitions, and clinical trial details, with diagrams of T cells, tumor cells, and immune interactions.

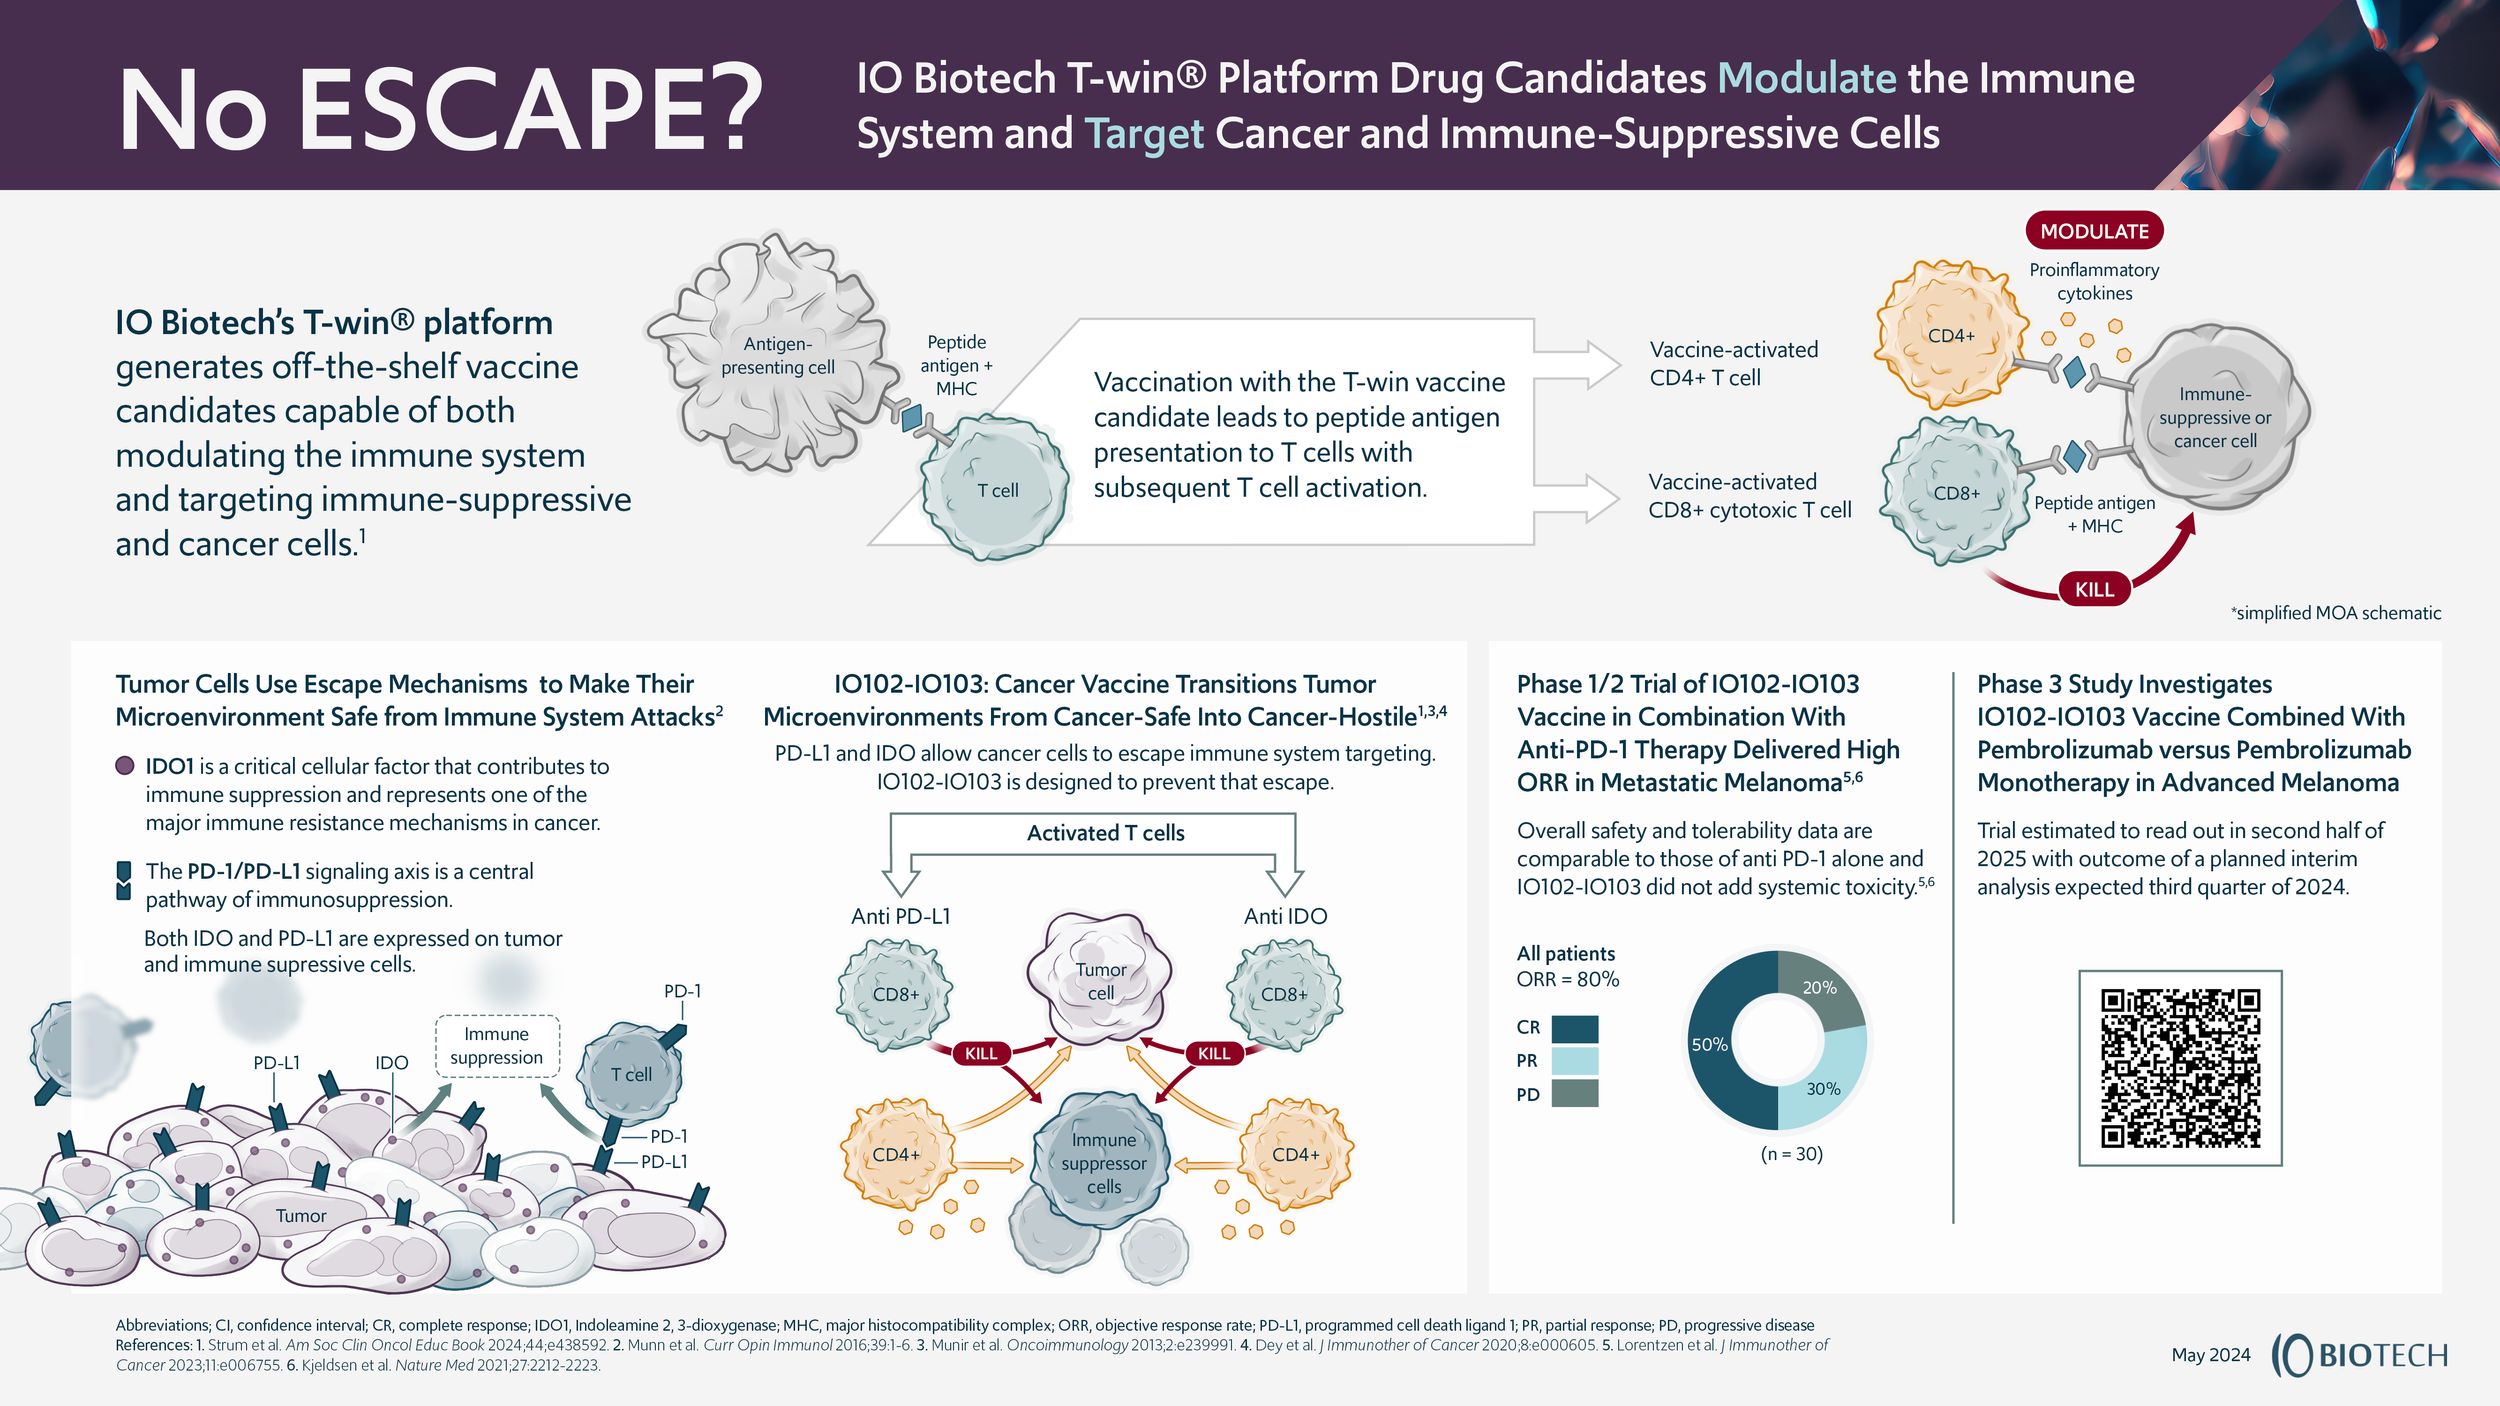
Infographic - Immune System Drug Technology Platform Overview

Infographic about bronchiectasis, showing a diagram of healthy and diseased lungs, and details about the condition's impact, symptoms, treatment, and statistics regarding diagnosis and costs in the US.

Bronchiectasis disease burden medical infographic

Diagram of the blood-brain barrier and Alzheimer's disease process. Shows brain, hippocampus cross-section, capillary, neurons, astrocytes, blood cells, microglia, cytokines, albumin, and related molecular interactions involved in aging, leaks, and neuron damage.

Scientific American - Alzheimer’s Disease 3D iinfographic

An infographic about COVID-19 vaccine development, highlighting factors like raw materials, active ingredients, and costs. It shows graphs comparing the costs of vaccine types, including DNA, mRNA, viral vector, traditional, and antibody treatments.

Vaccine development factsheet