Hologic STI screening
Our process

Content map
One of the main challenges we faced was incorporating a lot of copy into the infographic. The client wanted to approach this as a didactic comi, with speech bubbles for the characters and descriptive text for each step of the story.
As always we focused on text and information hierarchy. The visuals would come second to this. Here are some initial layout concepts that were dropped. The reason for this is that it was that the layouts presented made it difficult to follow a linear path/story.

Final content map
In the end, we landed on this layout where information hierarchy was easier to follow. A useful rule of thumb is to make sure the reader always starts with the follow linear flow:
Title: You always want the viewer to read the titled first
Subtitle: this is then followed by any subtitles or eyebrow copy, the subtitles are always smaller than the title
Intro paragraph: next you want the viewer to focus on the intro paragraph, this should always be placed close to the titles
Information buckets: The information buckets are the bulk of your infographic. You might have a few or many pieces of information that can be grouped into buckets. In this instance we have 4 steps in the story that we need to separate out. Therefore we opted for a linear didactic sequence that is similar to a comic strip. This allows readers to automatically view each information bucket in sequence from left to right.

Style frames
To get immediate buy-in from the client we drew up some style frames for them to approve before we moved into full illustration production.

The style frames were driven by the end client’s logo and website colours. We provided 3 options for them to choose from.
Challenges faced during colour design
When we came to presenting the colour layout, our agency client felt that the design was too bland and the title was lost in the information design.
Because of this we went back to the design board and explored multiple options for the agency to select from (see below)


Final options
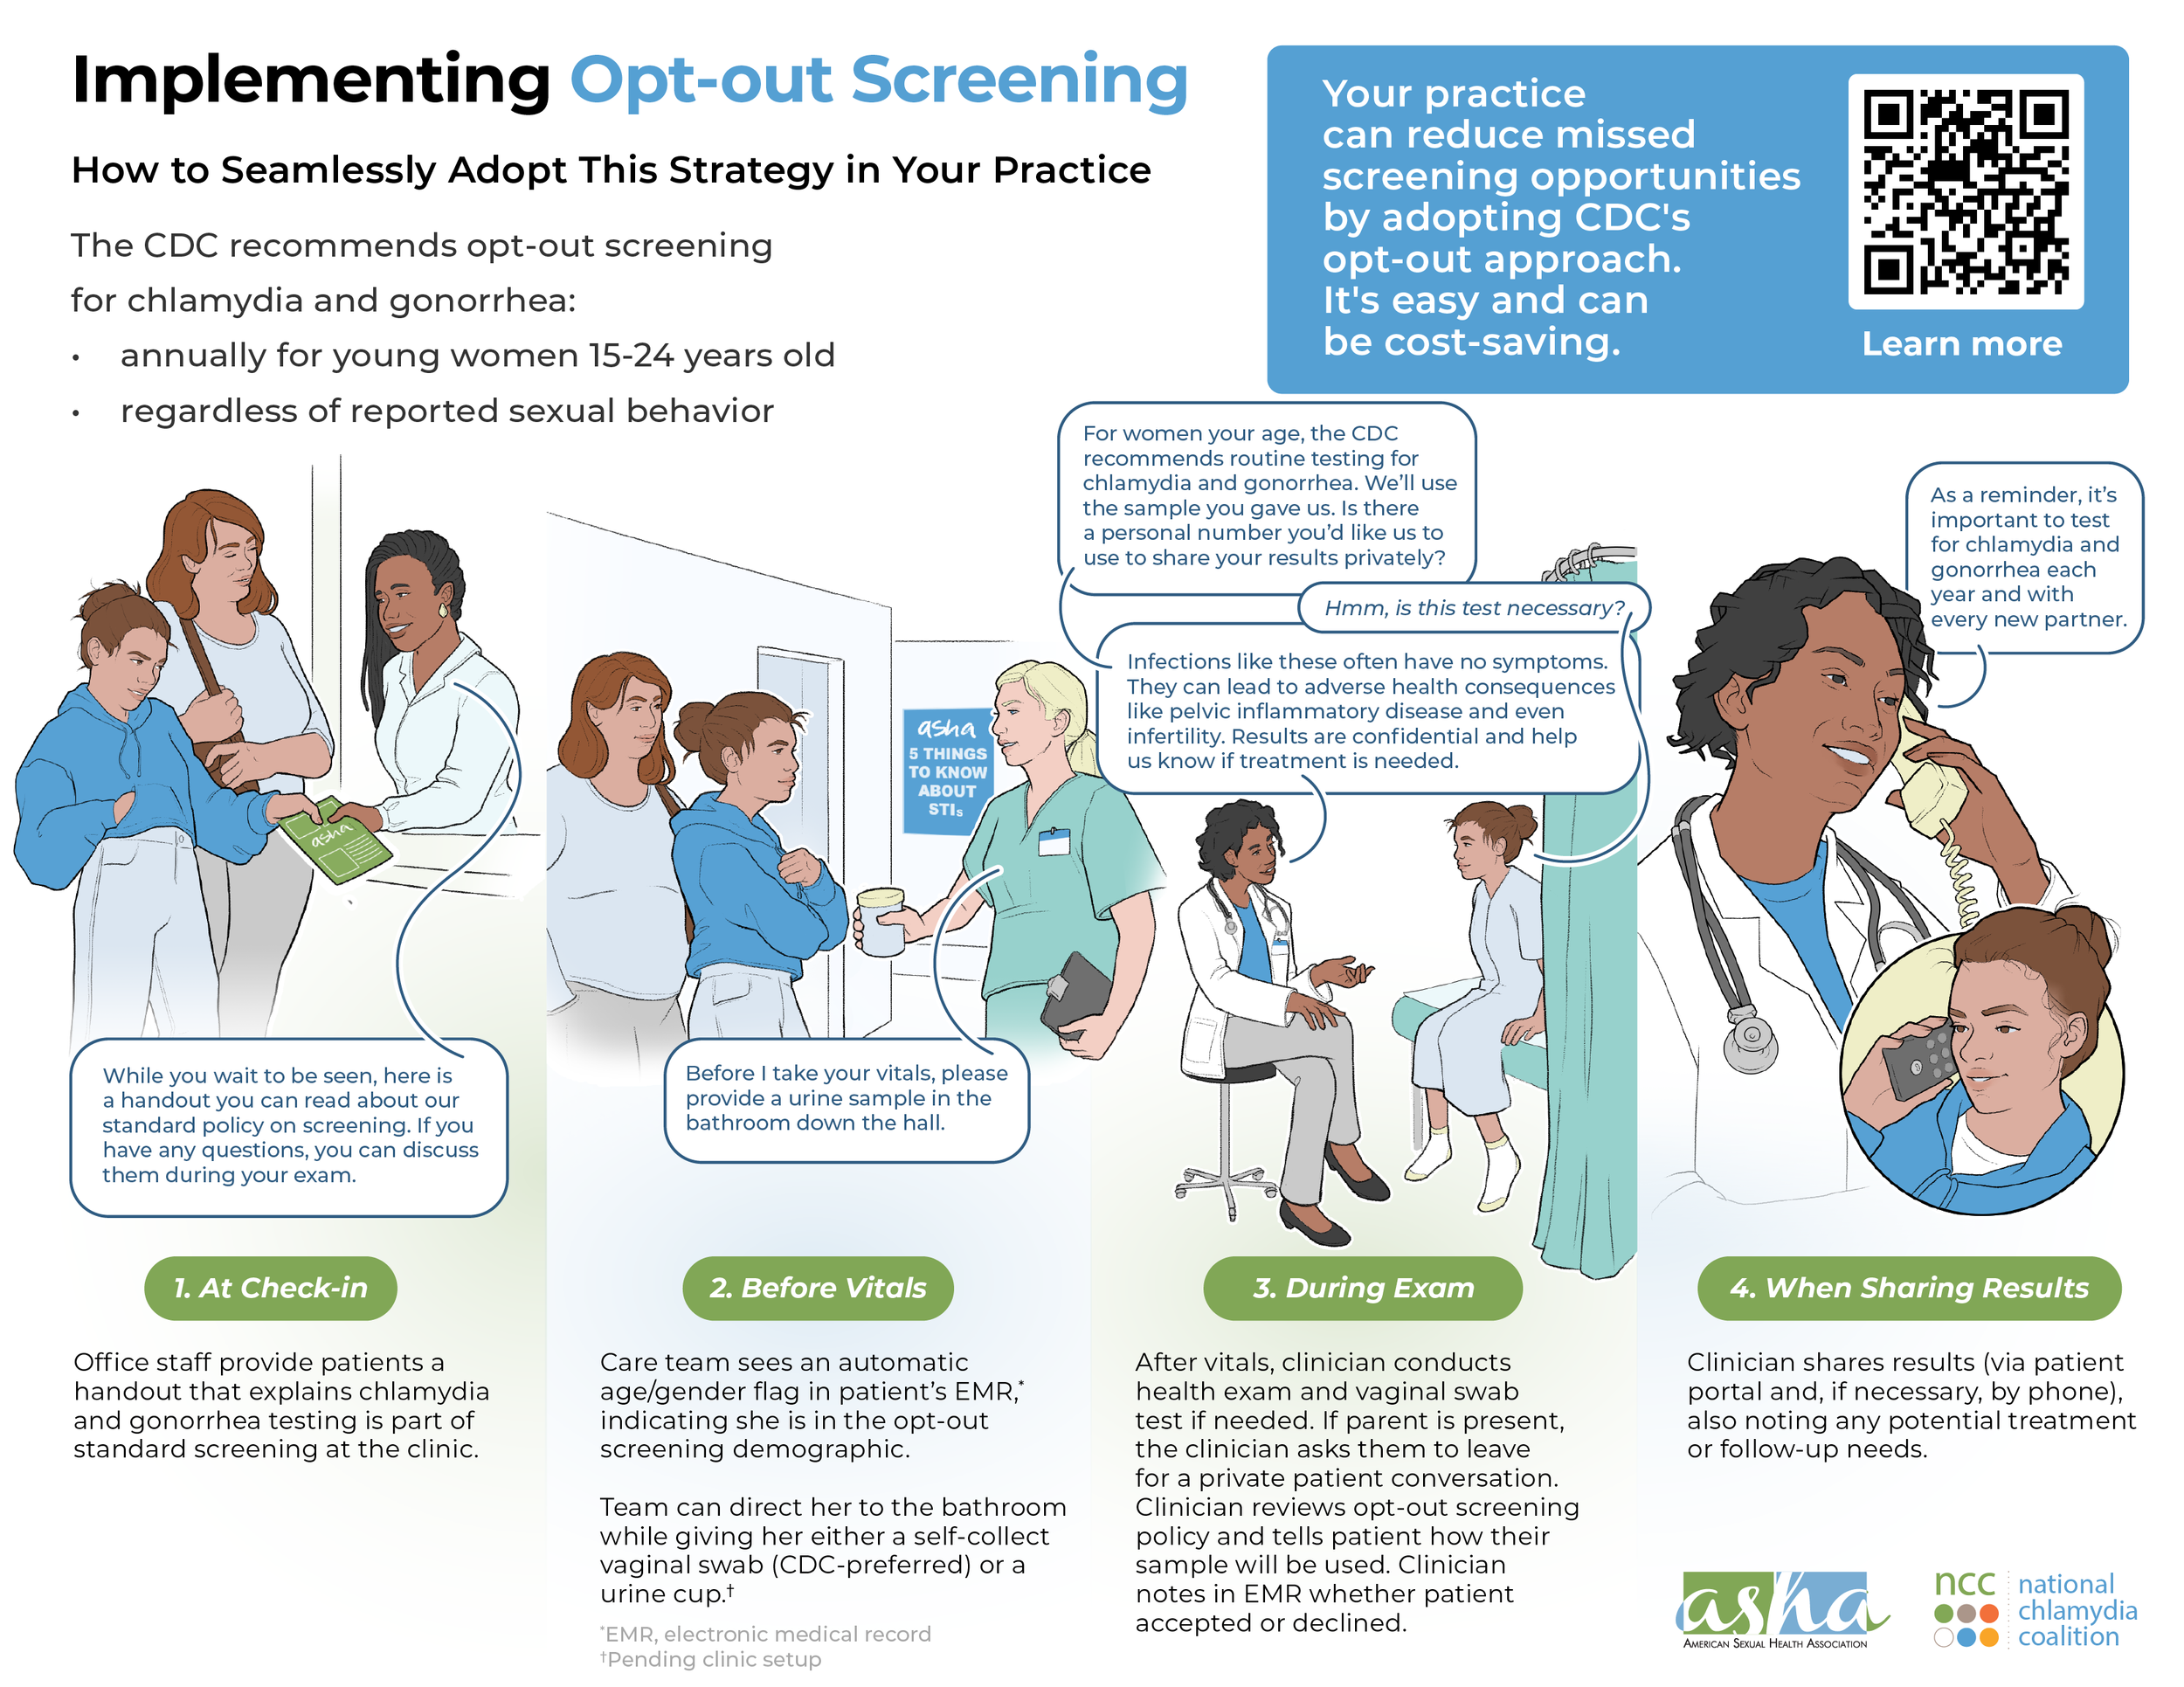
In the end, the agency presented the client with two options to choose from. The top hero image on this page is the final infographic that was delivered.
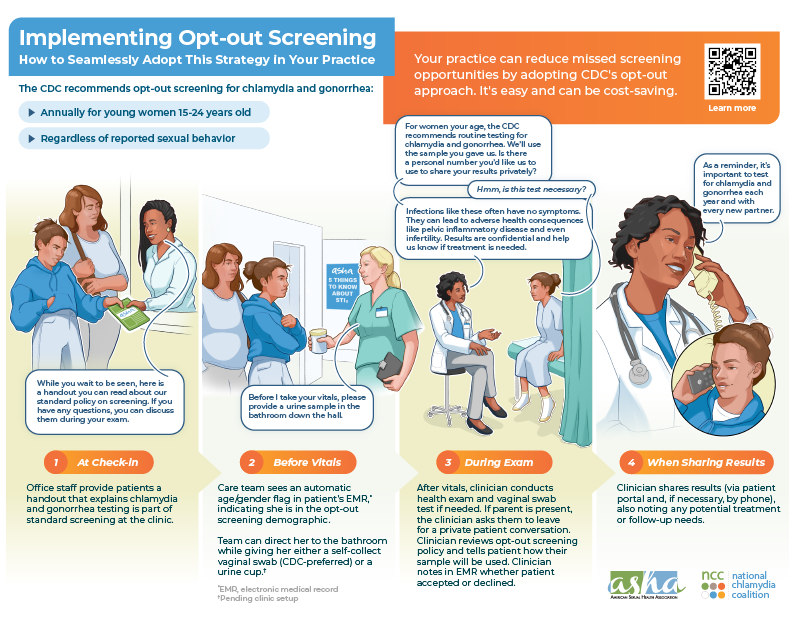
Figure illustration process
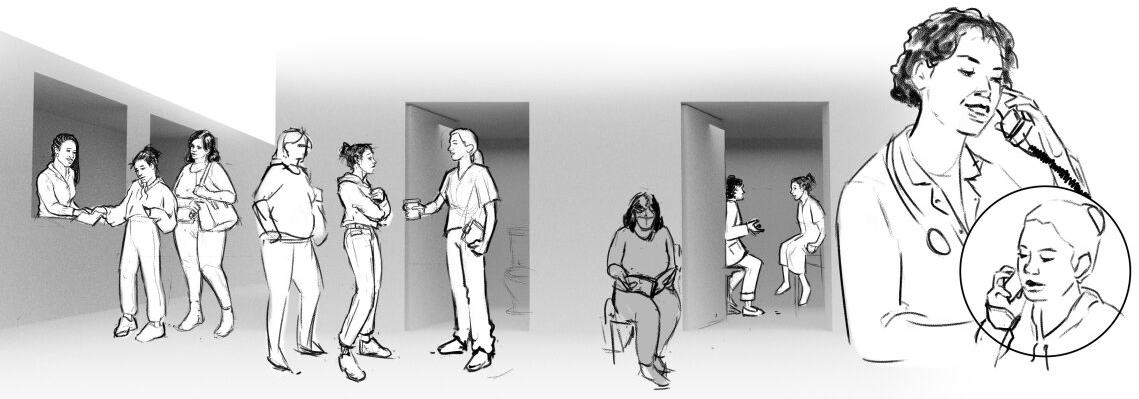
ABOVE: Here we created tight sketches of the 4 steps in the process. We also created a clinic environment in 3D so that we could create a stage/set that had accurate persepective to place all of the figures in.
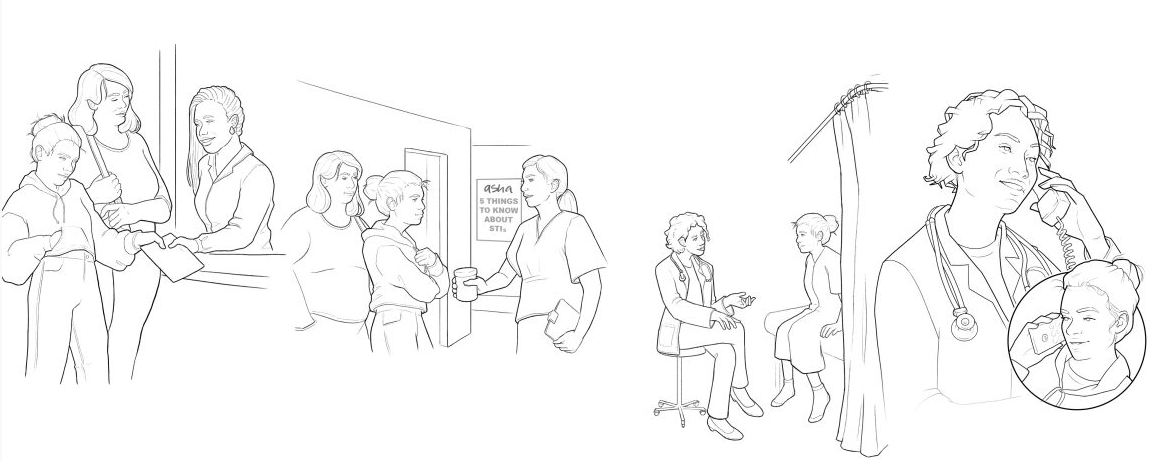
BELOW: Once we got approval for the figures from the client, we adopted our company house style and developed clean linework for the figures. This clean line style of thicker outer line and thinner inner detail lines means that we develop clean illustrations that work well on its own, without relying too heavily on colour to help us to provide visual clarity.


ABOVE: The illustrations were done in Photoshop as individual vignettes, these were then placed into the Illustrator file for final infographic layout. We chose Photoshop because for the illustrations because it gave us more flexibility in line details and allowed us to work quickly when it came to coloring in.
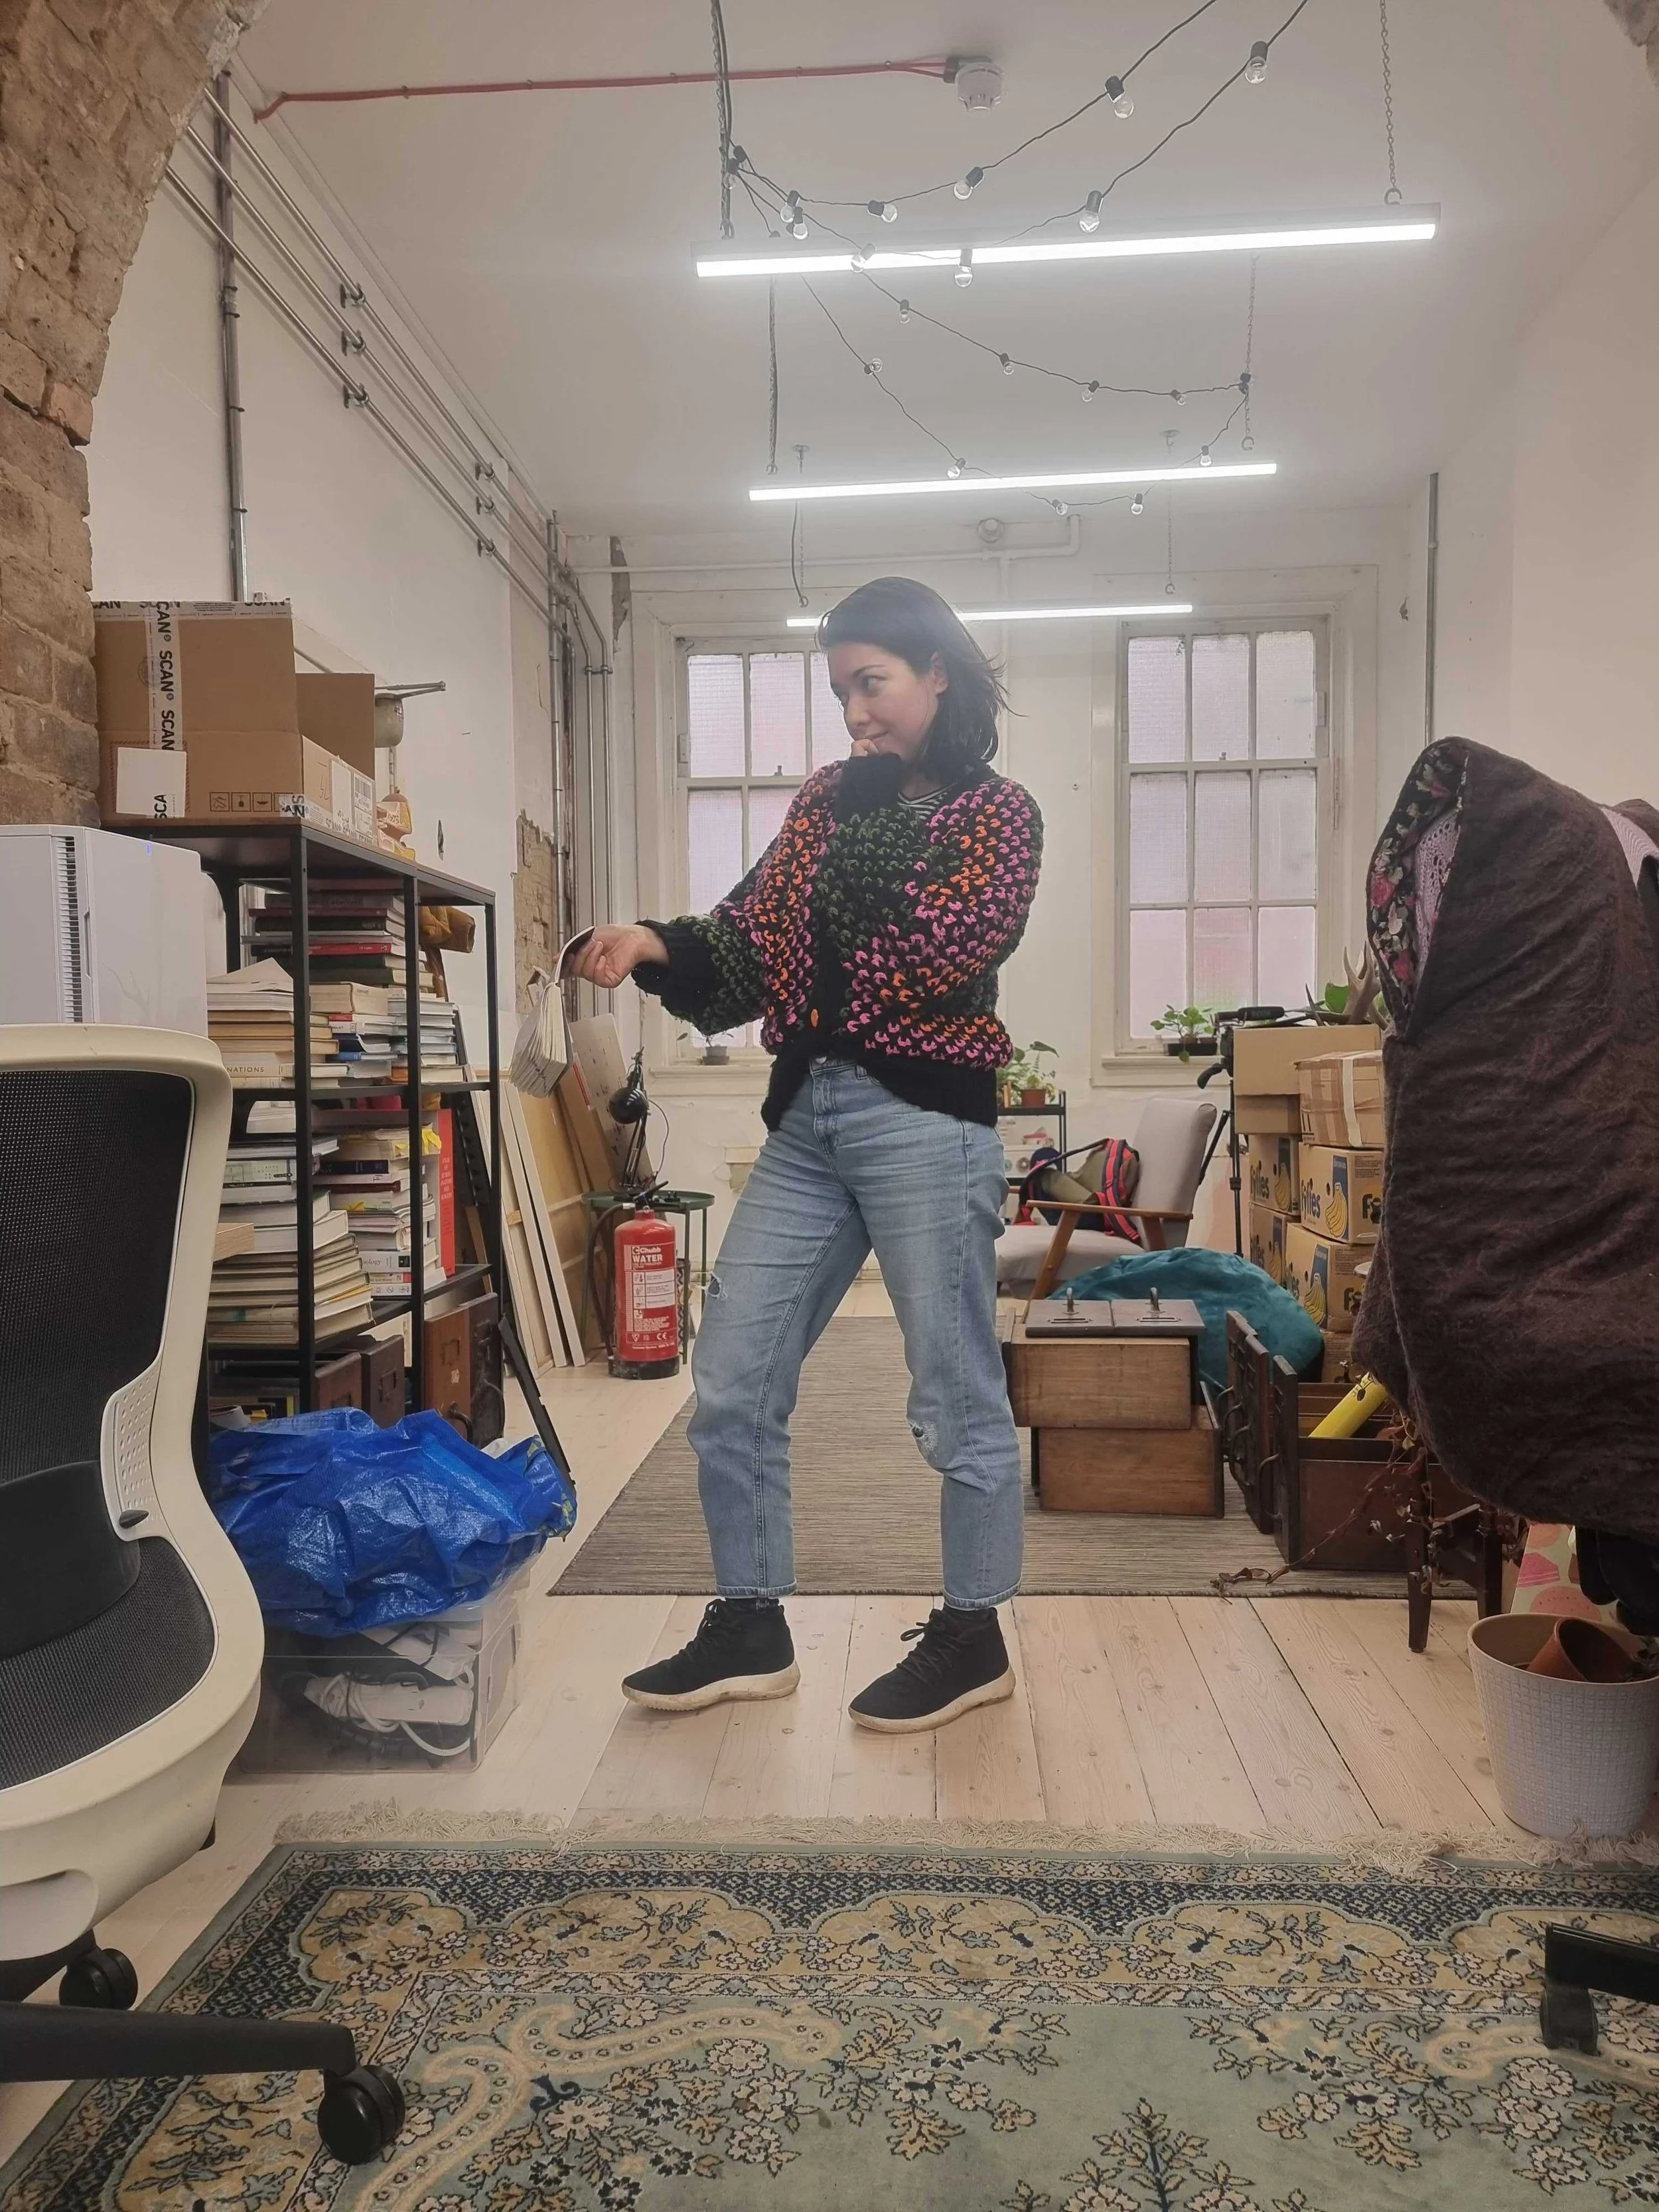
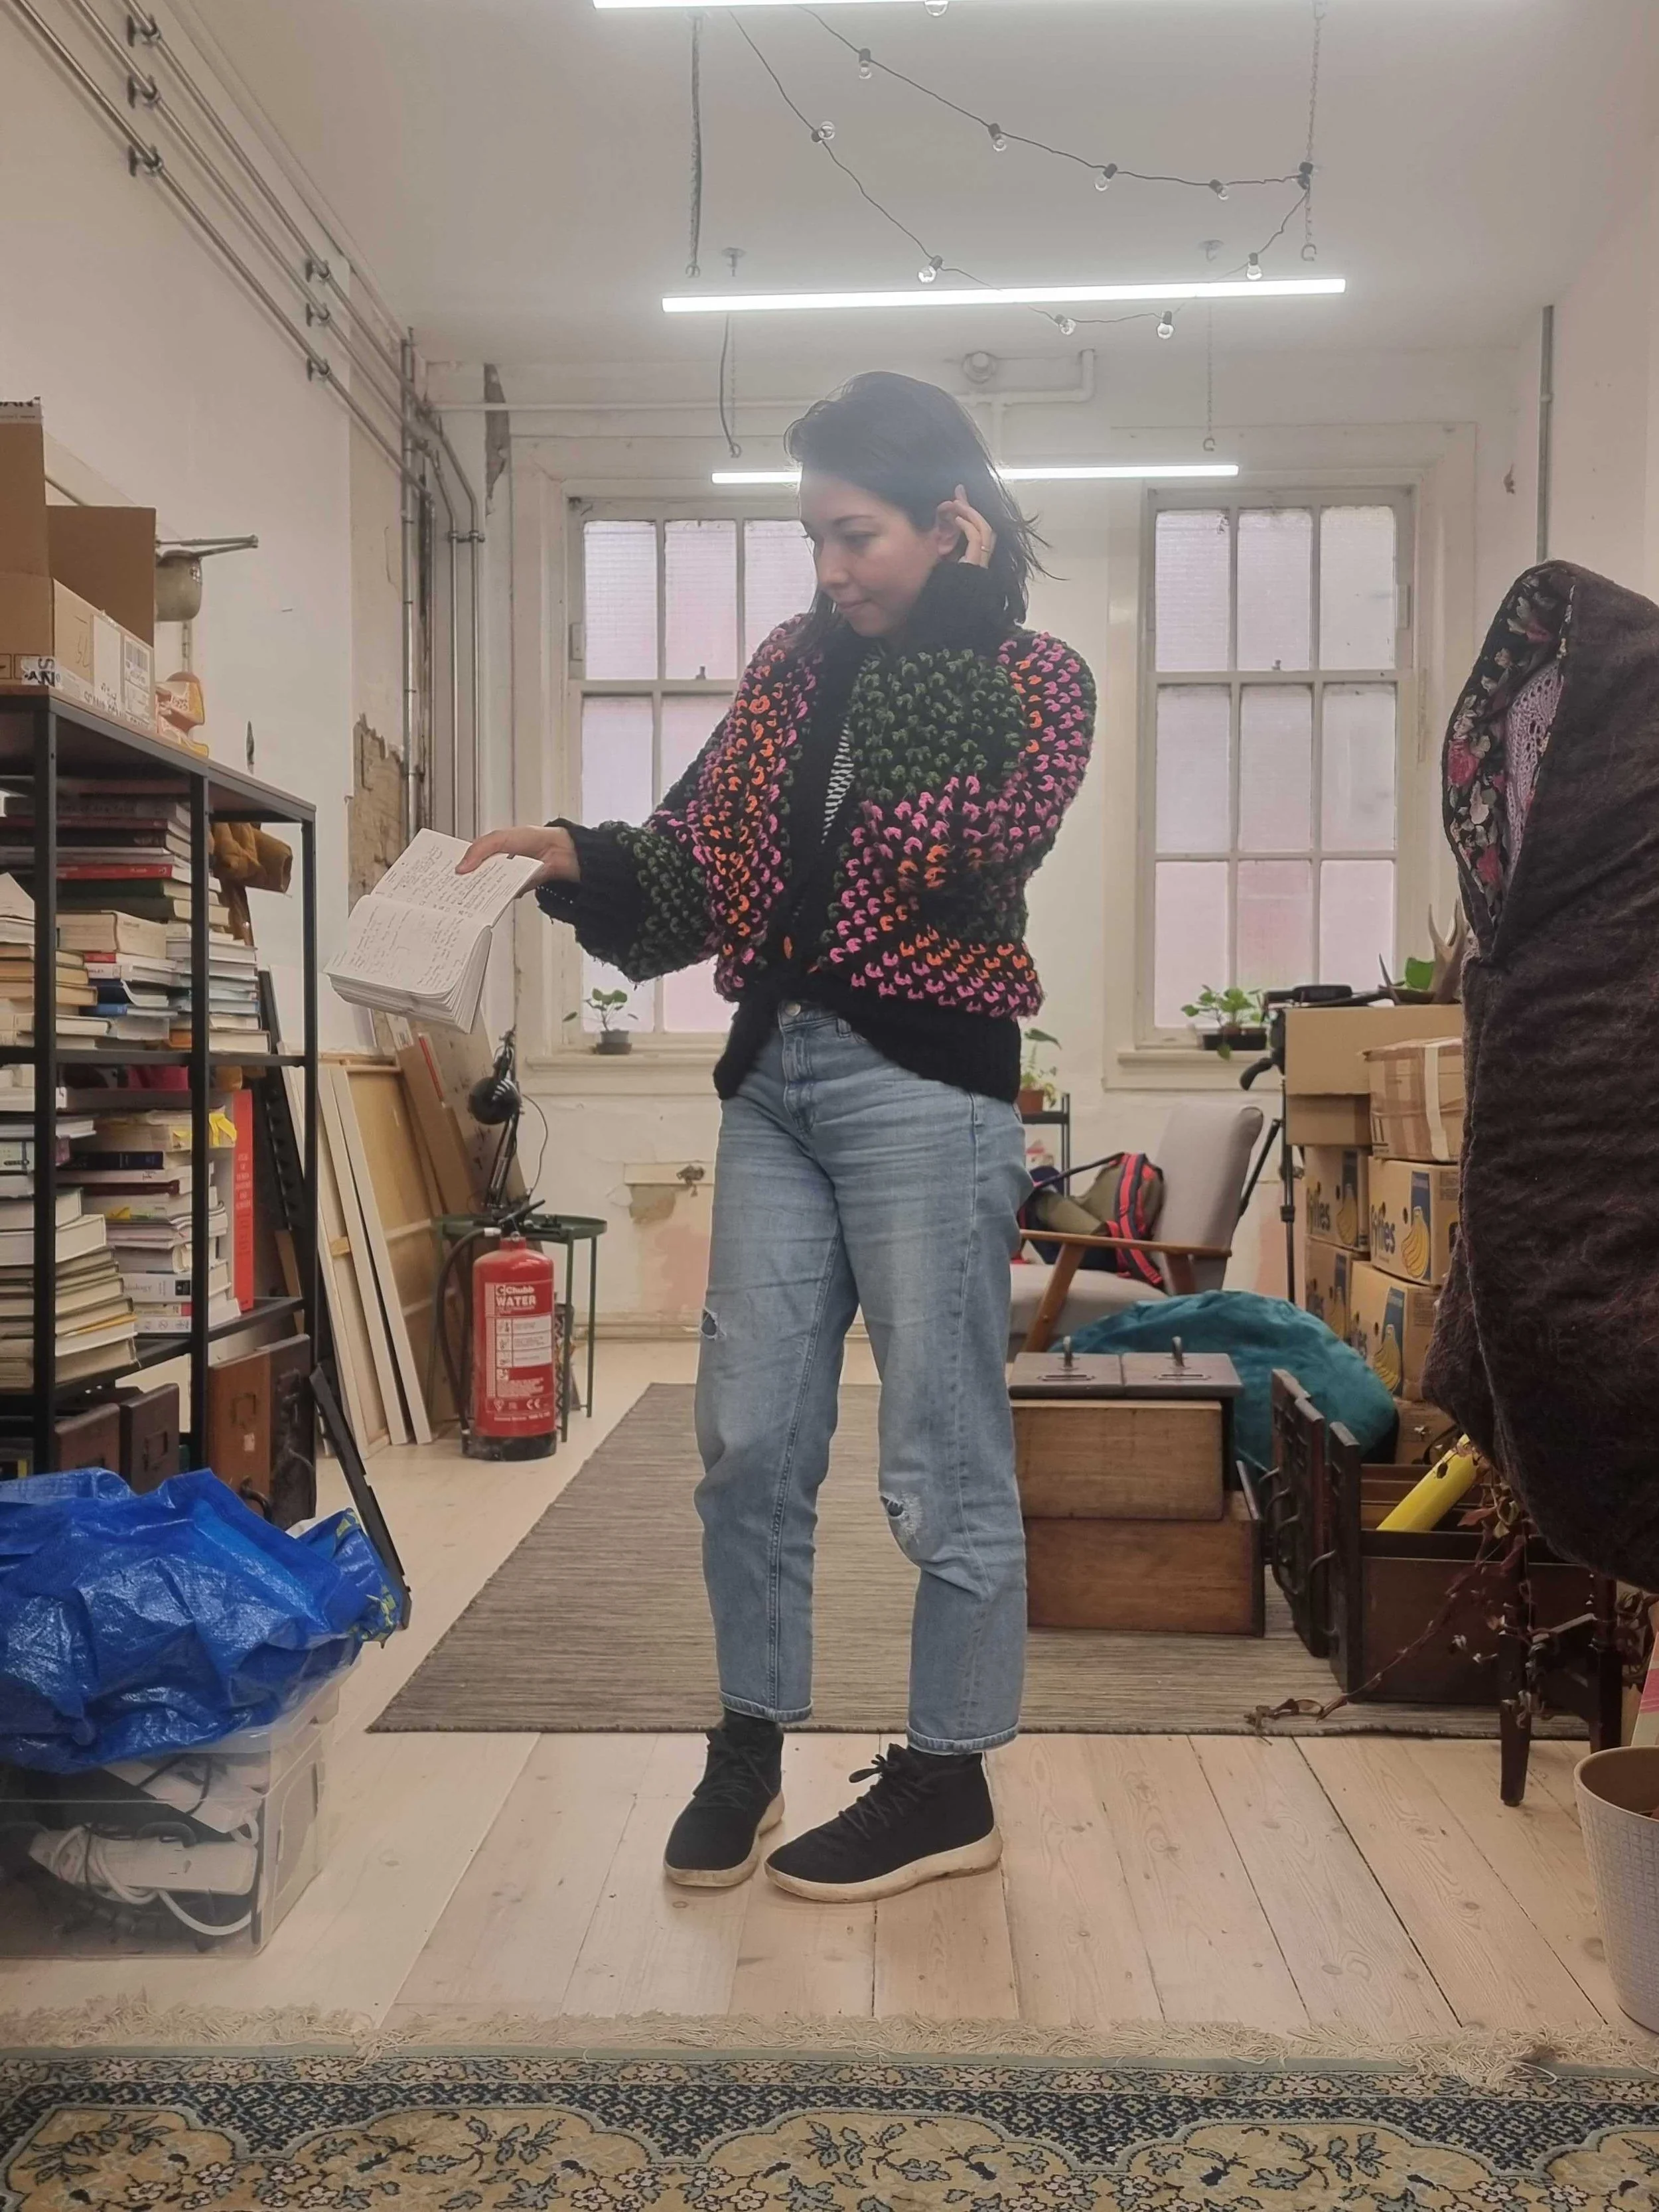

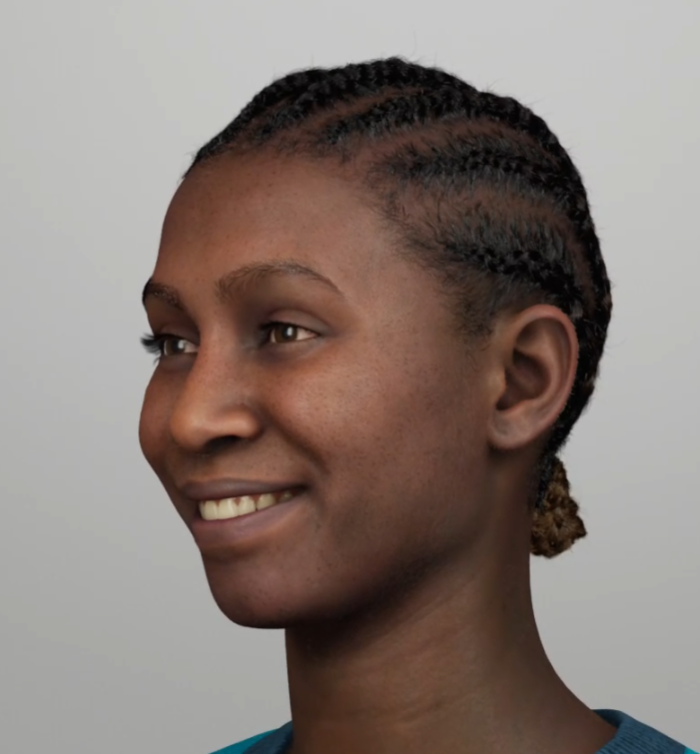
ABOVE: We used ourselves as references for main body poses, this allowed us to draw more realistic and accurate people as well as a reference for a range of emotions.
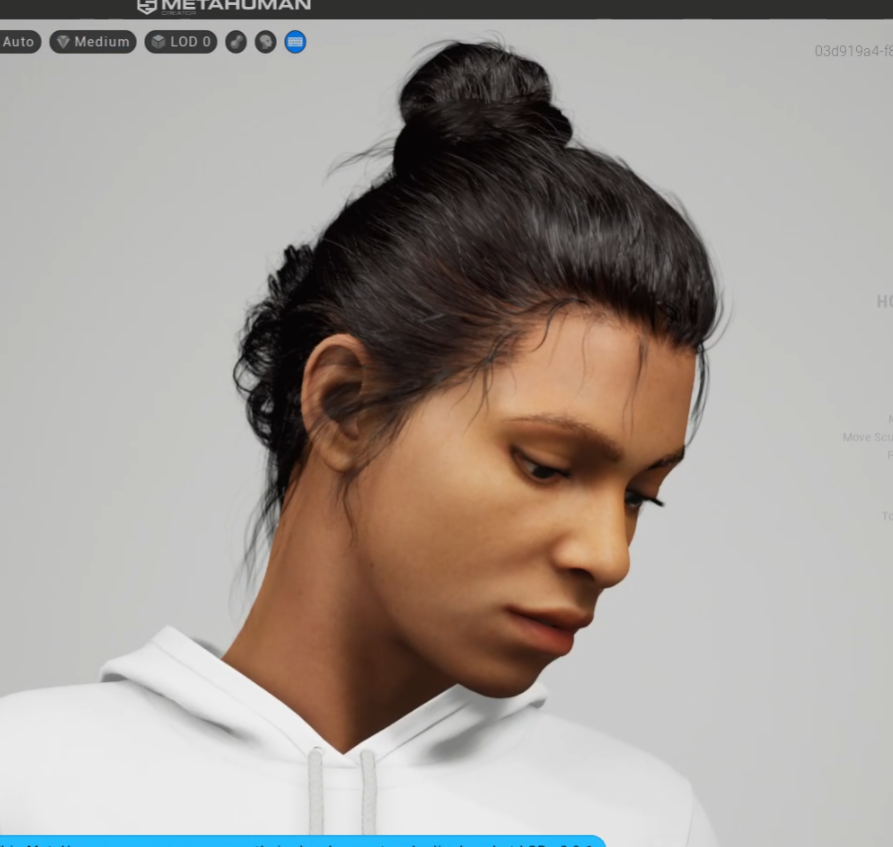
BELOW: To get figure references of different faces, we adopted MetaHuman models and customized them to create unique models for us to use as references for the different character faces.